logo

Carbon Tracer

Generation energy mix

The electricity that flows through our cables to reach the homes, offices (and other premises) of our customers comes from quite a wide range of sources. These sources of generation may be local to a given area or may flow in from much more distant sources through the National Grid’s high voltage transmission network. Some generation sources can be classed as renewable while others are non-renewable or nuclear. As the various forms of generation work, they create quite different amounts of carbon dioxide gas.

The local generation which is attached to the National Grid network typically includes large solar PV installations, wind farms and various incineration generators some of which are renewable forms of energy (for example biomass), while others are not. There are many other generation types including less common forms such as tidal and wave power and even newer forms such as battery storage.

When local generation is insufficient to meet demand at any given time and location, the shortfall is made up by taking electricity from the National Grid. Changes to prevailing conditions and what people are doing throughout the day and throughout the year means that the demand for electricity from customers is constantly changing. The available generation also changes all the time so that the overall mix is in a constant state of change. This is shown by the Carbon Tracer.

If you would like to know more about how we generate the information below, take a look at our FAQsWe also have a number of online Videos and Guides which tell you more about what we do in the community energy and network innovation areas.  These are available here.  To find out more about what we do as a Company please view some of our videos in our video library.

pinIconTo discover your generation mix, enter a postcode
pinIcon
information
logoYour energy generation mix
pinIcon{{postcode}}
information
{{getOverallStatusText(currentData.overallRagStatusDetailed)}}
{{getOverallStatusDescription(currentData.overallRagStatusDetailed)}}
{{getOverallStatusLargeDescription(currentData.overallRagStatusDetailed)}}
solarmoonLocal solar power{{statuses[currentData.solarRagStatus].status}}
windLocal wind power{{statuses[currentData.windRagStatus].status}}

Wind capacity

Wind power generation increases proportionally to the cube of the wind speed and requires a speed of around 5 m/s to begin to move the turbine blades. After the wind reaches a speed of around 12.5 m/s, the amount of power generated by a wind turbine reaches a plateau at maximum output. The turbines are only capable of operating in speeds of up to 25 m/s, so at speeds in excess of this they must be turned off to protect them from damage.

NOW
wind chart

The {{bsp.name}} substation is ranked {{bsp.windRanking ? bsp.windRanking : 0}} in the WPD area, ordered from highest wind power generation capacity to lowest.

Solar Info

Solar power generation output is variable, depending on the position of the sun in the sky, the temperature, and the weather. To calculate the red, amber and green ratings for solar power that you see within the Carbon Tracer, we use a daily power response curve, adjust it using the location of the substation (using local noon) and scale the power output according to the level of cloud and precipitation.

The graph below shows the solar power that could be generated today at the {{bsp.name}} substation, based on the elevation of the sun and given the time of local noon. Another line shows how the cloudiness and rain can diminish the solar output (this may appear as one line if conditions are very favourable today). When the curve is on the axis there is no solar output – corresponding to the time that the sun is not yet risen or has already set.

Potential Solar Output
Current Solar Output

The {{bsp.name}} substation is ranked {{bsp.solarRanking}} in the WPD area, ordered from highest solar power generation capacity to lowest.

boltIcon

The energy supplied to this location comes from the local substation shown above

Is this the current location?

If not simply navigate the map and move the pin to the correct area or try entering a postcode again.

Please note

The National Grid area includes East & West Midlands, South Wales and the South West.

logo

We use the data from our energy distribution network to calculate local energy mixes to generate results within this area.

We're sorry, but this location {{errorPostcode}} isn't in the National Grid area

The National Grid area includes East & West Midlands, South Wales and the South West.

We use the data from our energy distribution network to calculate local energy mixes to generate results within this area.

logo

We're sorry, but the data for this location is not available.

We are unable to provide a local energy analysis for your location, as the data for this location is incomplete.

This usually happens when the electricity is supplied by another Network Operator, even though it is within the National Grid area.

logo

Primaries Info

Every Bulk Supply Point (BSP) substation (the level at which the Carbon Tracer works) has a number of Primary Substations operating at the voltage level below it. The “primaries” provide onward connectivity to feed the electricity through to homes and businesses via the 11kv distribution network. A primary would be likely to supply a small number of villages and their environs or perhaps a city district, depending on the population density of the area. The BSP substation that you have selected has {{bsp.primaries.length}} primaries, shown below.

Primaries: {{exportPrimariesName(bsp.primaries)}}

Wind capacity

Wind power generation increases proportionally to the cube of the wind speed and requires a speed of around 5 m/s to begin to move the turbine blades. After the wind reaches a speed of around 12.5 m/s, the amount of power generated by a wind turbine reaches a plateau at maximum output. The turbines are only capable of operating in speeds of up to 25 m/s, so at speeds in excess of this they must be turned off to protect them from damage.

NOW
wind chart

The {{bsp.name}} substation is ranked {{bsp.windRanking ? bsp.windRanking : 0}} in the WPD area, ordered from highest wind power generation capacity to lowest.

Solar Info

Solar power generation output is variable, depending on the position of the sun in the sky, the temperature, and the weather. To calculate the red, amber and green ratings for solar power that you see within the Carbon Tracer, we use a daily power response curve and then adjust it using the location of the substation and to scale the power output according to the precise time of day and level of cloud and precipitation. We use the response value to scale an aggregated total figure for all solar generation registered as connected under the selected BSP.

The graph below displays a blue line for the solar power that could be generated today at the {{bsp.name}} substation, based on the elevation of the sun given the time of local noon. It would show 100% efficiency in mid-June. The second line in orange shows how we calculate that the current reported levels of cloud and rain act to diminish the solar output (the blue and orange lines may converge if conditions are very favourable today). When the curve is on the axis there is no solar output – corresponding to the time that the sun is not yet risen or has already set. Solar response curves are tall and broad in summer and short and narrow in winter.

Potential Solar Output
Current Solar Output

The {{bsp.name}} substation is ranked {{bsp.solarRanking}} in the WPD area, ordered from highest solar power generation capacity to lowest.

Substation Demand Profile

The highest point of usage occurs at the time of the day when the maximum amount of energy is being drawn from a substation. This is known as ‘maximum demand’. For example, in an urban area, this is likely to be during the evening when people return home from work and start cooking, heating and heating water for baths or using kettles. Maximum demand usually occurs between 17:00 and 20:00.

At this substation and on this date, that time is {{bsp.busiestHour + 1}}:00, when the maximum demand can reach levels of {{currentDemand | dp}} megawatts (MW). The pattern for usage over a 24 hour period is shown on the graph below, where the up axis represents how much energy is being used and the along axis is the time of day. There are different patterns for the seasons of the year, as the load on the substation varies depending on factors like the weather and temperature.

The global maximum demand for this substation (ie. the highest demand attained in any given year) is {{bsp.maxDemand | dp}}MW.

Substation Type

A substation can be classified as urban or rural by the density of houses and therefore number of people living in that area. This substation is of type “mixed”, meaning that the density falls somewhere between these two extremes. Typically solar and wind generation requires the space that you find in rural areas over urban, so there may be some at this substation.

A substation can be classified as urban by the density of houses and therefore number of people living in that area. Urban substations are likely to have high energy demand, but relatively low local energy generation, due to limited space in the area to accommodate solar parks, windfarms and incinerators. This means that energy is most likely to be sourced from the national grid during times of high demand.

A substation can be classified as rural by the density of houses and therefore number of people living in that area. Rural substations are likely to have lower peak demand levels than urban substations. Most solar and wind power generation comes from rural areas, so the energy mix is likely to contain less carbon than that of an urban area.

This substation has a load profile which shows a peak in demand around noon, characteristic of a location showing a presence of a significant amount of light industry over domestic properties. There may still be some domestic properties in this area however, though substations of this type are relatively rate and are mainly found in the Birmingham area.

The following generation types, and their capacities are registered at the {{bsp.name}} substation:
  • {{gen.name}} - {{gen.mWh | number : 2}}MW

Solar Noon

Solar noon happens when the sun reaches the North South meridian line passing through a given location and is therefore at its highest point in the sky. The rotation of the earth shifts the meridian experiencing solar noon from east to west, meaning that the local solar noon is earlier to the east of a location, and later to the west.  The amount of sunlight affects the solar power produced from photovoltaic panels, and therefore must be used in our calculations.  The Local Noon is used for each substation to adjust when the sun is highest in the sky and solar power production reaches its maximum. Due to its longitude, and another effect called the equation of time, the local noon for {{bsp.name}} occurs today at {{currentData.localNoonTime}}.

Created by

National Grid

National Grid is the company responsible for electricity distribution in the Midlands, South West and Wales. Our business serves over 7.8 million customers and we employ over 6,500 members of staff to ensure the highest quality of service

Find out more

The Carbon Trust

The Carbon Trust is a not-for-dividend company that helps organisations and companies reduce their carbon emissions and become more resource efficient. Its stated mission is to accelerate the move to a sustainable, low carbon economy.

Find out more
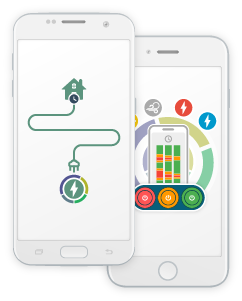
Smartphones with Carbon Tracing App logo.

Carbon Tracer App

The Carbon Tracer is available on Google Play and the App Store, for Android and Apple devices. Try moving your energy usage based on which hours are greenest or reddest to discover what level of energy efficiency you have!

Update: Please note that we're currently working on adding enhanced substation information to the apps so that they match the website - a new version will be coming soon!

Our app is now available on Google Play and the App Store on Apple Devices

androidLogoiosLogo